When you visualize does it materialize? On the effects of (data) visualizations in research
Sep 7, 2024· ,·
1 min read
,·
1 min read
Joachim Gassen
Sebastian Geschonke
Tobias Witter
Abstract
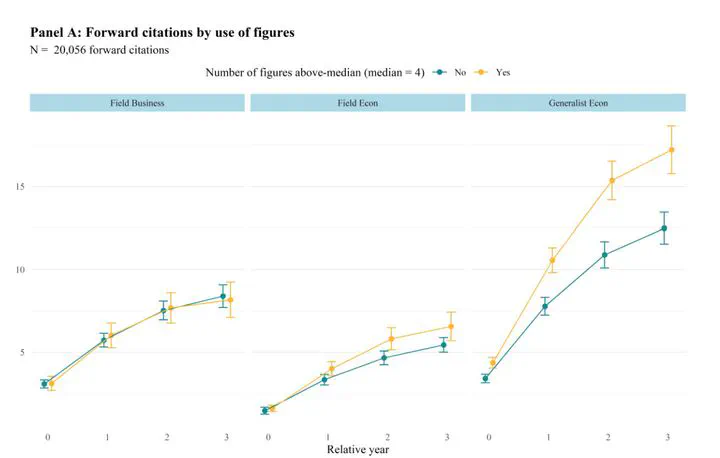
We study how researchers in economics visualize their quantitative findings and how this affects the impact of their work. Our analysis is based on observational and experimental data. Using articles from a set of leading (field) journals in economics, we first document that articles in generalist economics journals use relatively more figures than tables with both being used as complements for data visualization. In business and economics field journals, tables and figures are used as substitutes with tables being more common. Next, we show that across all our journals the use of visualizations (table or figures) is associated with higher impact as assessed by citations. This association seems to be predominantly driven by the use of figures in economics journals, while for business journals we find some suggestive evidence that the use of tables is more consistently associated with citation impact. Turning to the nature of data visualizations, we find that there is no clear difference in data-transparent visualizations (i.e., those that represent distributional properties, error intervals, or data points) across journal types. In generalist economics journals, however, these visuals seem to be a driving source for the association of figures with citations. To assess the causal link between visualization types and research impact, we conduct a large online experiment with scientifically trained participants. Randomizing different visualization types across participants, we fail to document an overall discriminating treatment effect for tables and figures consistent with the relative strengths of both visualization types and their ability to act as substitutes. However, we find that our participants assess studies using data-transparent figures as more internally valid and citable compared to studies featuring simple figures. This effect is predominantly driven by participants with a background in the natural sciences and speaks to the ability of researchers from this field to process highly informative data visualizations.
Type
Podcast of article (13min)
Using Google Notebook LM, I created a podcast discussing the article. You can get an excellent first impression of the idea and results from it.
Please listen: